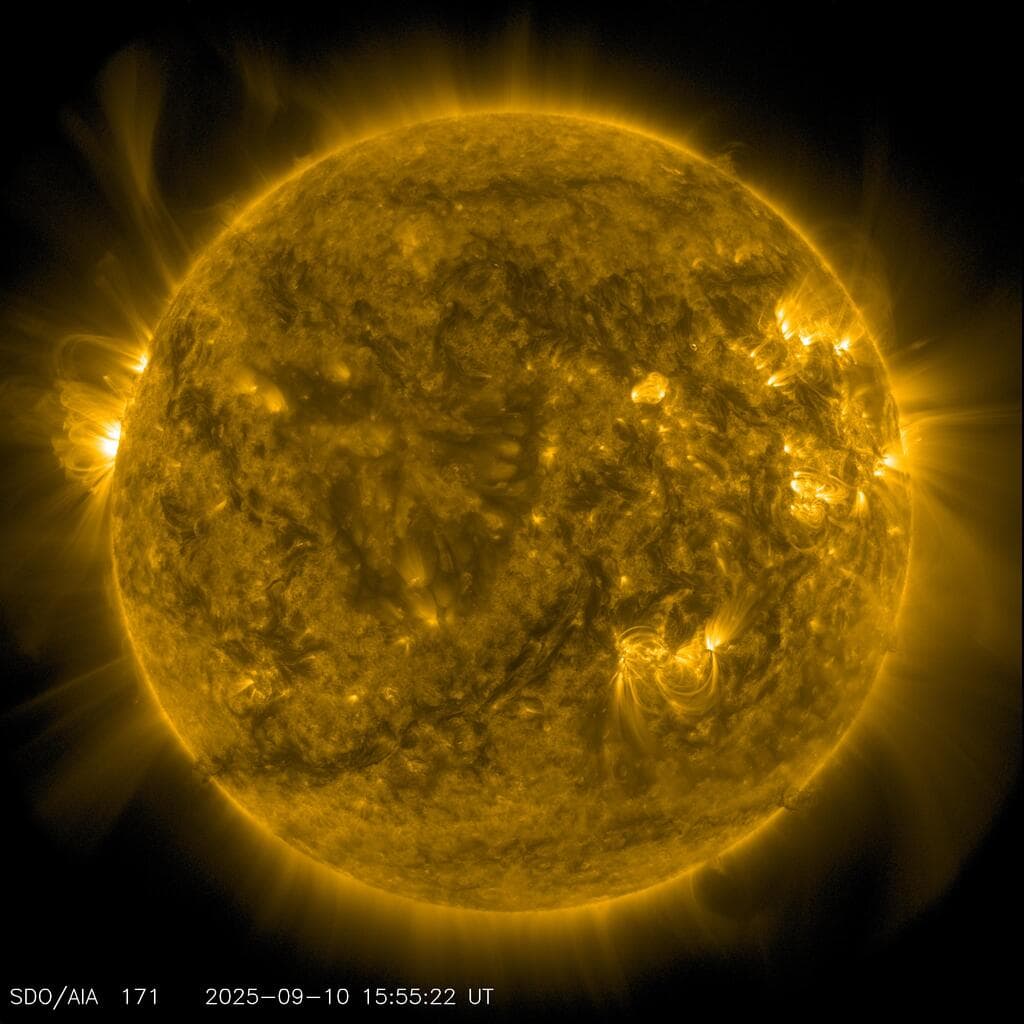
Unlike the Moon, the Sun is constantly rotating from our perspective - but we still only see half of it at any given time. Since it takes 27 days to complete a full rotation, that leaves plenty of time for changes to happen to the side we can’t see that could directly impact Earth’s own space weather a few weeks later. Now a team of physicists led by Bibhuti Kumar Jha of the Southwest Research Institute has published a paper in The Astrophysical Journal Supplement Series that uses probability to map out what might be happening on the far side of the Sun, even if we can’t see it directly.
In the past, space weather forecasters have struggled with this critical cosmic blind spot. Coronal Mass Ejections, one of the most dangerous forms of space weather, can fry satellites or overload ground-based power grids. And the conditions for them could form on the side of the Sun facing away from us so that we only get warning of them once they turn the corner of the Sun itself.
Sure, we had computer simulations of what might be happening around the Sun’s back, but they were mainly just guesses. So the authors turned to a technique that, though it has been around for a few decades, is still an evolving field of research. Helioseismology is similar to traditional seismology on Earth, where geologists use seismic shockwaves from earthquakes to map the interior parts of Earth that we can’t see from the outside.
Solar physicists took that same general concept and modified it for use on the Sun. It may sound impossible to “see” through a giant ball of burning plasma, but it's possible with high energy acoustic waves. The churning motions that power the convective zone of the Sun itself also create sound waves that both bounce inside the Sun itself and reflect off its surface. Crucially, if those sound waves happen to pass through an active region, the magnetic fields concentrated there will slightly shift their travel time.
While that doesn’t sound like much to go on, instruments like the Helioseismic and Magnetic Imager aboard NASA’s Solar Dynamics Observatory and the ground-based Global Oscillation Network Group are able to measure these slight ripples on the near side of the Sun, and use some fancy math to figure out where the magnetic knots representing sunspots are gathering on the far side. The problem has been reliability.
Fraser talks about the Carrington Event - the strongest solar storm directed toward Earth on record.
The signals of these acoustic waves have been notoriously noisy, creating “ghost” active regions that can pollute solar forecasts with fake sunspots - essentially making the heliophysicists look like they’re crying “wolf” every time they see a potential sunspot on the far side in the data. But the solution isn’t just to ignore the messy data - then we’d leave ourselves open to the risk of a dangerous sunspot developing and having even less warning on how to deal with it.
To solve the noise problem, Jha and his co-authors turned to historical data from a mission called STEREO. This involved two NASA spacecraft that were placed around the far side of the Sun, but still within direct communication lines of Earth. Between 2010 and 2014, the mission collected extreme ultraviolet images of what was happening on the far side - the exact type of data needed to build a validation model of what the far side would look like - assuming we have acoustic data that was synchronous with those observations.
Luckily, SDO was operating at the same time, so the researchers were able to cross-correlate the ultraviolet images from STEREO with the magnetic readings from SDO, but it wasn’t a direct correlation - the authors had to scale the signal into proper magnetic units. Once they did, though, they were able to plug their calibrated data in a model called the Advective Flux Transport model, which accurately simulates the plasma flows and magnetic fields that are critical in heliophysical models.
https://music.youtube.com/podcast/R8_XwBxWsn0 Fraser discusses how bad a solar storm would be for a moon base.
What they found was a stark contrast between the regular models and the reality represented by the data from STEREO. Their updated method smoothly updates the locations of the sunspots even while they’re still hidden on the other side of the Sun, which was much more accurate than the jagged “jumps” other models attribute to the same sunspots. Also, when they zoomed out to the entire star, they realized that conventional models had been underestimating the total unsigned magnetic flux by 10-20% of the Sun's total magnetic flux budget. That is a huge underestimation, especially for something as critical to the successful operation of an entire industry as space weather.
This is only another step in the process of truly understanding our solar neighbor. Turning sound waves into verified magnetic maps of the far side of our star is an excellent step towards coming up with a fully integrated model of how sunspots form, but we’re still a long way off from a fully functional early warning system for these potentially dangerous events. Hopefully we’ll get that figured out without having to experience a wake up call of only a few days' notice before we’re blasted with solar radiation.
Learn More:
SwRI - SwRI-led team develops improved model for mapping the Sun
B.K. Jha et al - A Probabilistic Framework for Incorporating Helioseismic Far-side Active Regions into Surface Flux Transport Models
UT - How Flare Ribbons Reveal Hidden Solar Explosions on the Sun
UT - Ringing the GONG: New Details About the Sun's Far-side Activities